After submitting your queries, the results will be shown in the bottom of search tools. Six tabs of [Basic], [Protein], [GO], [Pathway], [Disease (DO)] and [Disease (DOLite)] can be browsed
[Basic information]
Basic information includes chemical 2D/3D structure, hydrogen-bond acceptor, hydrogen-bond donor, IUPAC name, INCHI, INCHIKEY, molecular formula, molecular weight, canonical SMILES, isomeric SMILES, topological polar surface area (TPSA) as shown in the following figure.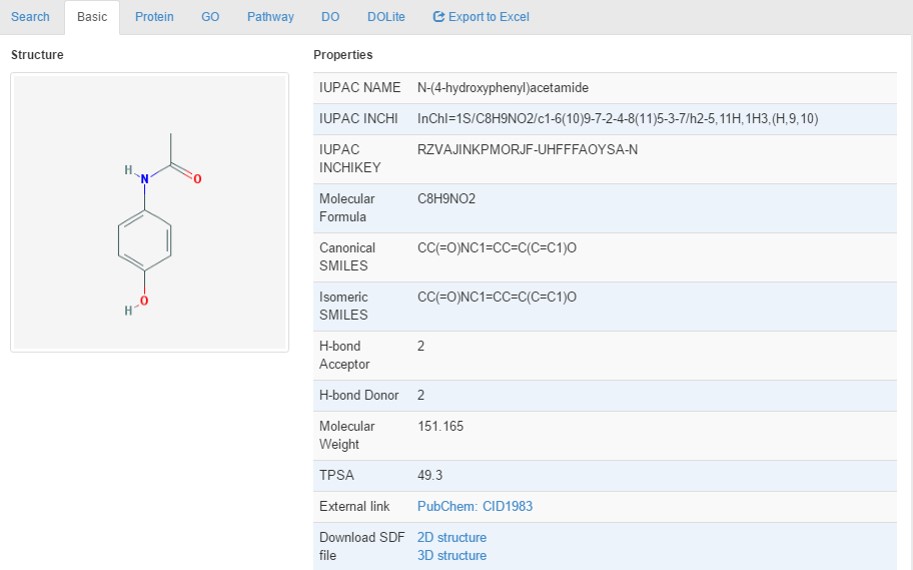
[Protein]
Protein tab provides interacting proteins associated with a given chemical. Ensembl protein ID, Gene Symbol, Description and Score are provided with links to Ensembl and NCBI gene databases as shown in the following figure. For the score, please refer to the sction 'What is the score' for detail.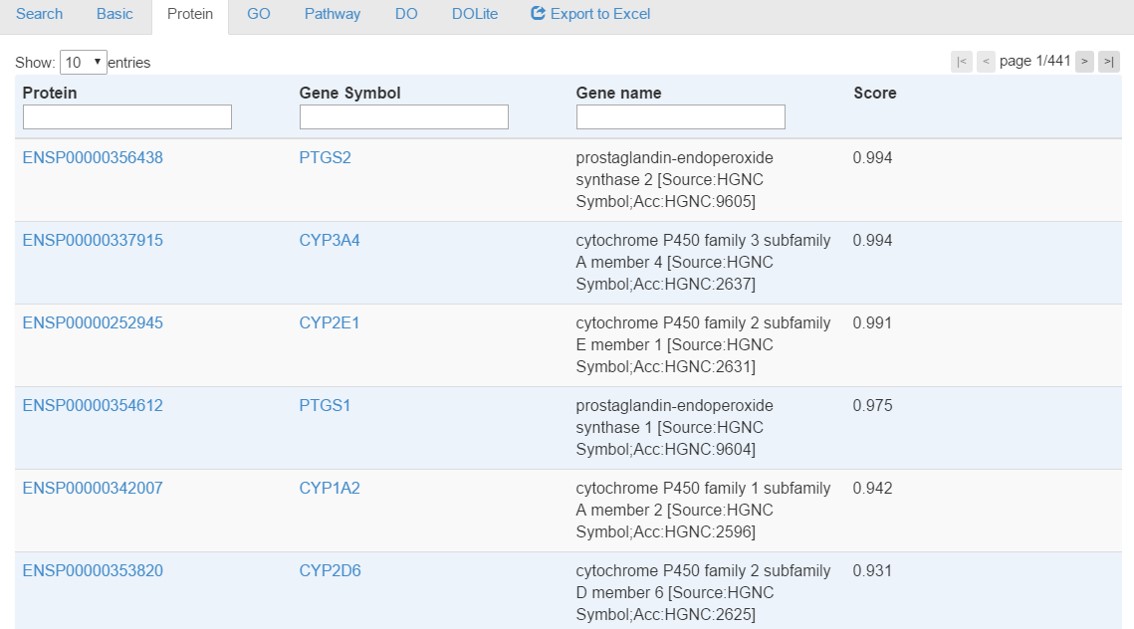
- In the top left, users can choose to show how many entries per page
- In the top right, users can change the page number to browse the data
- Protein, Gene symbol and descriptions is searchable by typing keywords in the corresponding fields of head row of table.
- All the headers of table is clickable for sorting.
- When all analyses are done, a link [Export to Excel] will appear for downloading a Excel file contatining all information.
[GO]
GO tab provides enrichment analysis results using hypergeometric tests with Benjamini-Hochberg correction for multiple testing. Enriched terms with a corrected p-value<0.05 will be identified.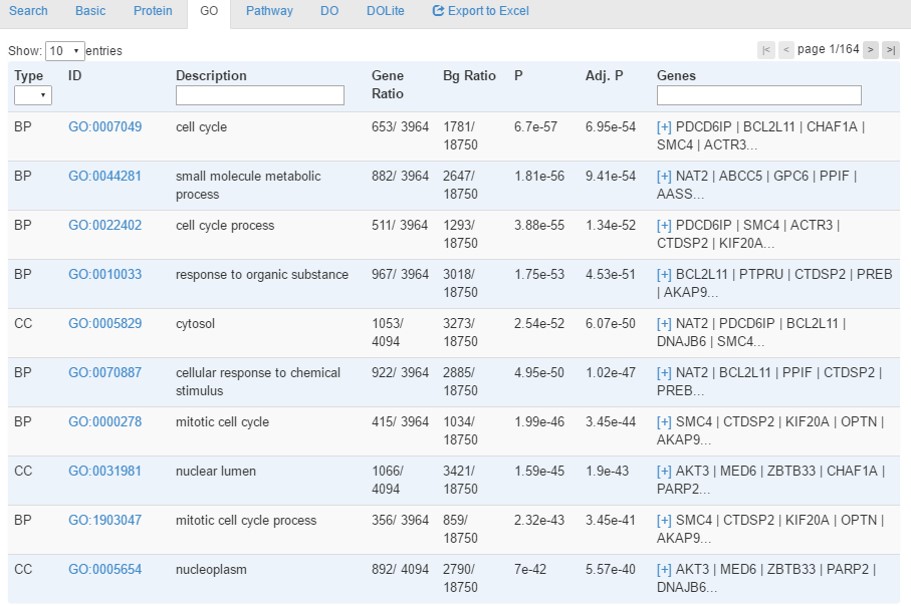
- In the top left, users can choose to show how many entries per page
- In the top right, users can change the page number to browse the data
- Protein, Gene symbol and descriptions is searchable by typing keywords in the corresponding fields of head row of table.
- For filtering proteins with score, a sliding bar is adjustable for showing proteins in a range of scores. Please note the filtering DOES NOT affect the analysis results. To conduct analysis using different score threshold, please utilize the search options as mentioned in the sction "How to perform a search"
- All the headers of table is clickable for sorting.
- For the 'Type' column, Molecular Function, Cellular Component and Biological Process are abbreviated as MF, CC and BP, respectively.
- The 'ID' column is clickable for linking to external database of QuickGO.
- For the 'Genes' column, if too many gene are associated with the term, only part of the gene list will be shown with a link of '[+]' that is clickable for checking the detailed information. By clicking the '[-]' link, the cell will go back to the original form with only part of gene list
- When all analyses are done, a link [Export to Excel] will appear for downloading a Excel file contatining all information.
- Please refer to [What are the columns in the result tables] for detailed information of columns
[Pathway]
Pathway tab provides enrichment analysis results using hypergeometric tests with Benjamini-Hochberg correction for multiple testing. Enriched terms with a corrected p-value<0.05 will be identified.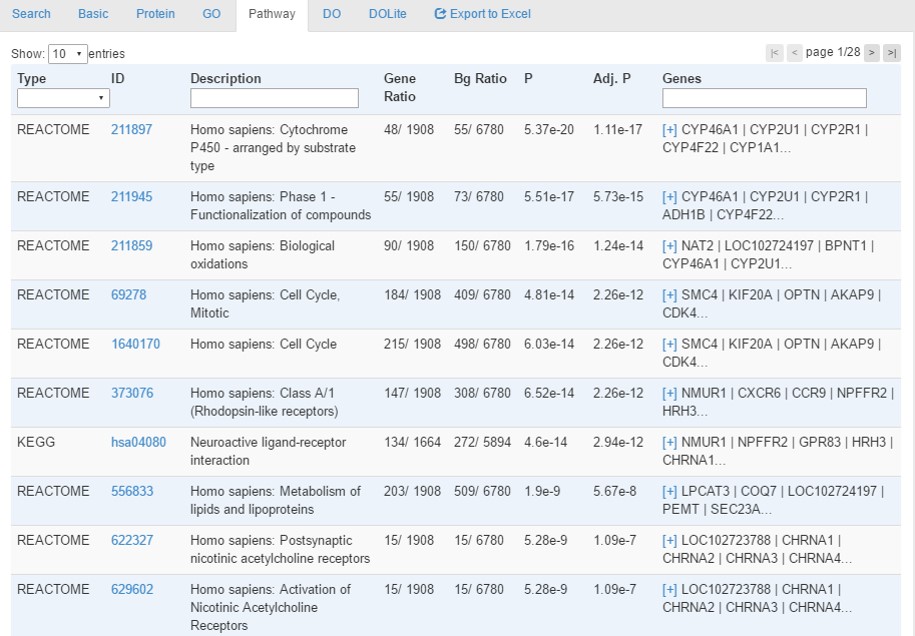
- In the top left, users can choose to show how many entries per page
- In the top right, users can change the page number to browse the data
- Protein, Gene symbol and descriptions is searchable by typing keywords in the corresponding fields of head row of table.
- For filtering proteins with score, a sliding bar is adjustable for showing proteins in a range of scores. Please note the filtering DOES NOT affect the analysis results. To conduct analysis using different score threshold, please utilize the search options as mentioned in the sction "How to perform a search"
- All the headers of table is clickable for sorting.
- For the 'Type' column, KEGG and Ractome pathways are abbreviated as KEGG and RACT, respectively.
- The 'ID' column is clickable for linking to external database of KEGG and Reactome.
- For the 'Genes' column, if too many gene are associated with the term, only part of the gene list will be shown with a link of '[+]' that is clickable for checking the detailed information. By clicking the '[-]' link, the cell will go back to the original form with only part of gene list
- When all analyses are done, a link [Export to Excel] will appear for downloading a Excel file contatining all information.
- Please refer to [What are the columns in the result tables] for detailed information of columns
[Disease (DO)]
Disease tab provides enrichment analysis results using hypergeometric tests with Benjamini-Hochberg correction for multiple testing. Enriched terms with a corrected p-value<0.05 will be identified.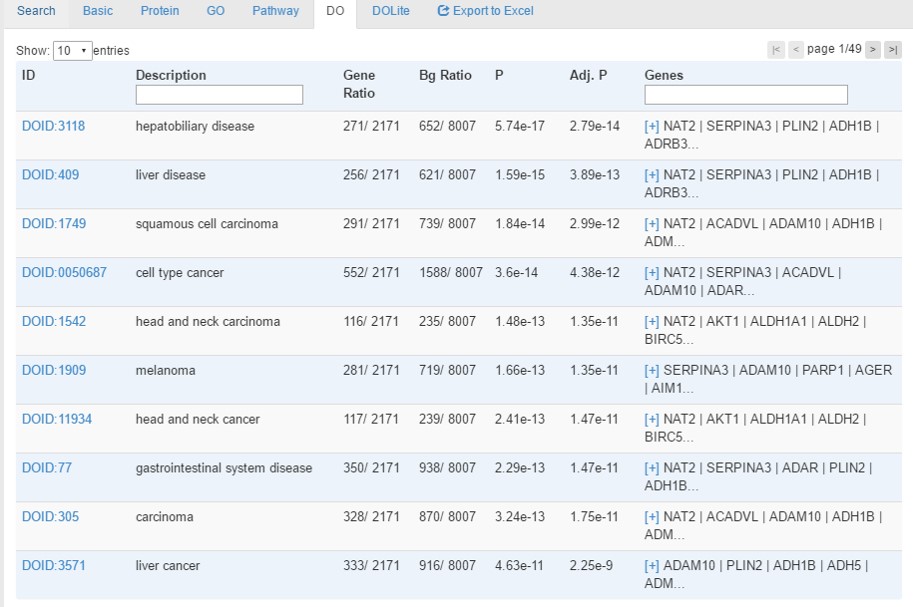
- In the top left, users can choose to show how many entries per page
- In the top right, users can change the page number to browse the data
- Protein, Gene symbol and descriptions is searchable by typing keywords in the corresponding fields of head row of table.
- For filtering proteins with score, a sliding bar is adjustable for showing proteins in a range of scores. Please note the filtering DOES NOT affect the analysis results. To conduct analysis using different score threshold, please utilize the search options as mentioned in the sction "How to perform a search"
- All the headers of table is clickable for sorting.
- The 'ID' column is clickable for linking to external database of Disease Ontology.
- For the 'Genes' column, if too many gene are associated with the term, only part of the gene list will be shown with a link of '[+]' that is clickable for checking the detailed information. By clicking the '[-]' link, the cell will go back to the original form with only part of gene list
- When all analyses are done, a link [Export to Excel] will appear for downloading a Excel file contatining all information.
- Please refer to [What are the columns in the result tables] for detailed information of columns
[Disease (DOLite)]
- Disease tab provides enrichment analysis results using hypergeometric tests with Benjamini-Hochberg correction for multiple testing. Enriched terms with a corrected p-value<0.05 will be identified.
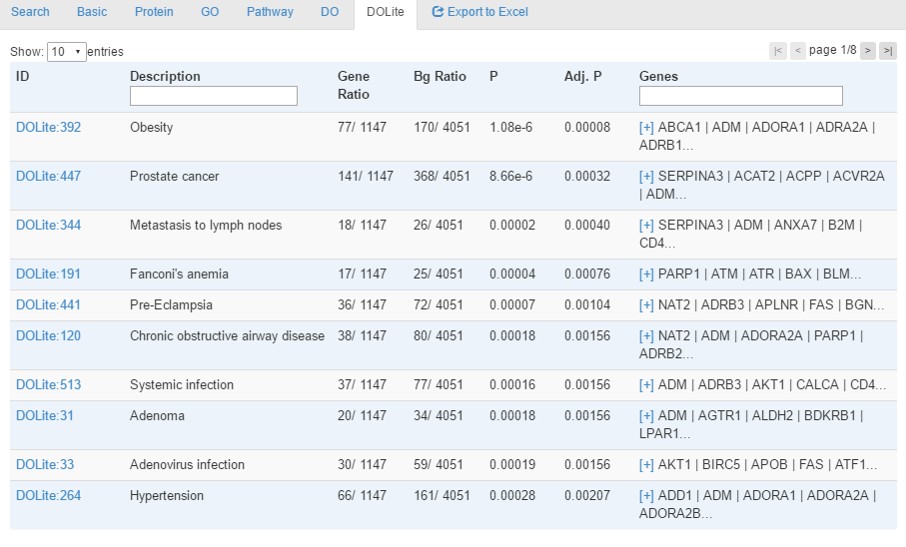
- In the top left, users can choose to show how many entries per page
- In the top right, users can change the page number to browse the data
- Protein, Gene symbol and descriptions is searchable by typing keywords in the corresponding fields of head row of table.
- For filtering proteins with score, a sliding bar is adjustable for showing proteins in a range of scores. Please note the filtering DOES NOT affect the analysis results. To conduct analysis using different score threshold, please utilize the search options as mentioned in the sction "How to perform a search"
- All the headers of table is clickable for sorting.
- The 'ID' column is clickable for linking to external database of Disease Ontology Lite.
- For the 'Genes' column, if too many gene are associated with the term, only part of the gene list will be shown with a link of '[+]' that is clickable for checking the detailed information. By clicking the '[-]' link, the cell will go back to the original form with only part of gene list
- When all analyses are done, a link [Export to Excel] will appear for downloading a Excel file contatining all information.