Multi-omics analysis is bascially an extension to Custom Analysis providing an easy way to do joint analysis of enrichment results from a few sets of user-provided lists of genes/proteins/metabolites/miRNAs
The function can be accessed by selecting 'Multi-omics' link as shown in the following figure. The green button
 [+] is clickable for adding more sets of genes/proteins/metabolites/miRNAs
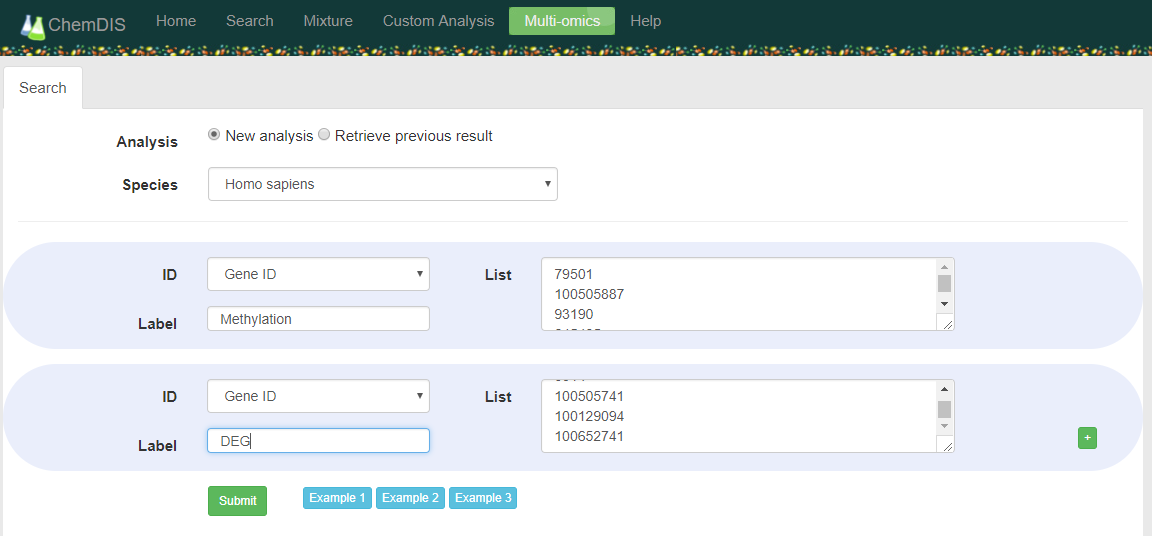
- User can choose to start a new analysis or retrieve previous study using the auto-generated ID.
- Unrecognized items will be discovered and a link in the bottem will show up. By clicking the 'Remove [Not Found!]' link, the unrecognized items will be automatically removed. After removing all unrecognized items, users are ready to go for the analysis by clicking the botton 'Submit'

- When everything is done, there will be an link 'Export to EXCEL' for downloading all results as an Excel file.
- The analysis will have a auto-generated ID for retrieveing the analysis results. All results will be kept for one week.
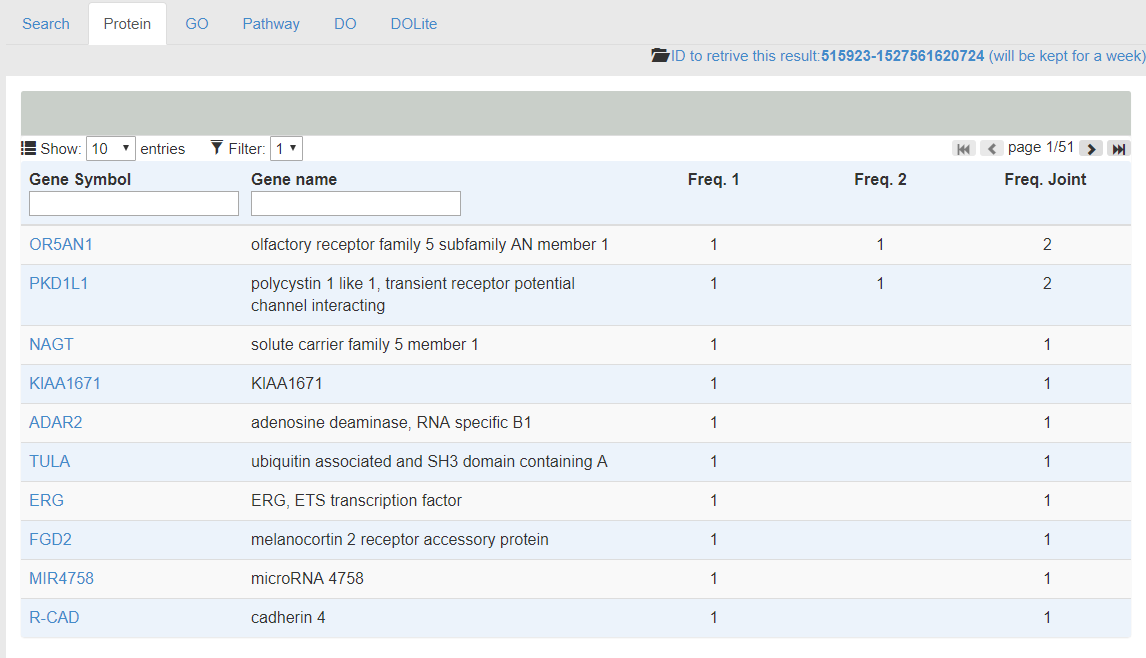
- The following figure shows the results of input proteins. Freq. 1 and 2 represent the existing of proteins in the input sets. The Freq. Joint shows the total count of occurence for each protein. In the figure, OR5AN1 and PKD1L1 are common proteins supported by both omics data.
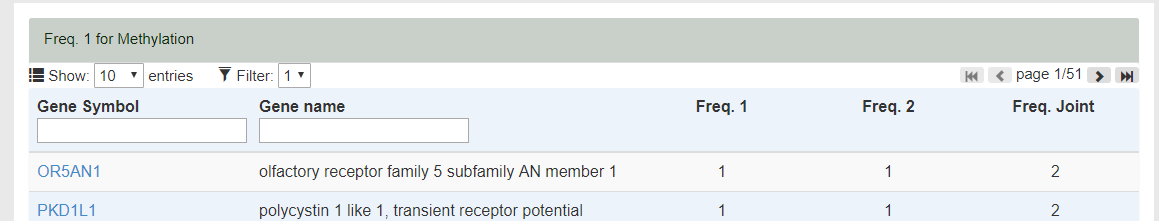
- By hovering the labels of Freq. 1/2, the corresponding label inputed by users will be shown in the Table Head. E.g., Freq. 1 for Mehylation.
- By clicking on the buttons for GO, Pathway and DO, corresponding analysis results show be shown.
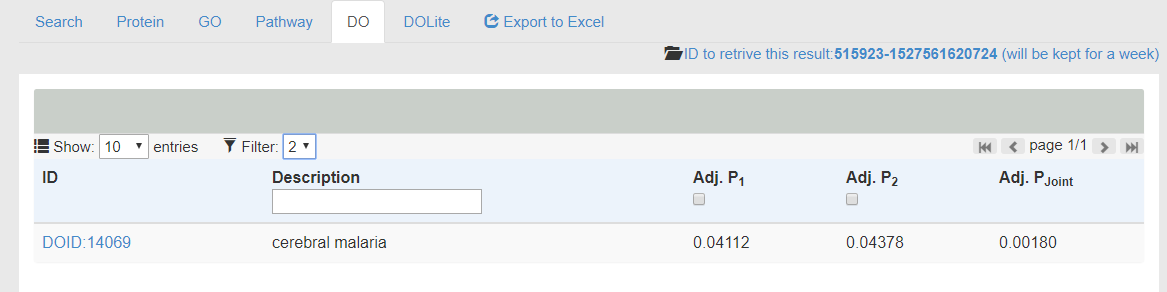
- The example results of DO is shown in the following figure.

- The enriched terms will be shown in the table with Adj. p-value for each user-supplied sets. The symbol '-' means no significant association between the term and the supllied data. Adj. Pjoint is the multiplication of all p-values that could be utilized to select the most significantly enriched terms supported by multiple omics data.
- The Filter function in the Table Head can be utilized to view only terms supported by multiple omics evidence as shown in the following figure. For example, after the application of filter (n=2), there is only one term supported by both evidence with an Adj. Pjoint value of 0.0018.